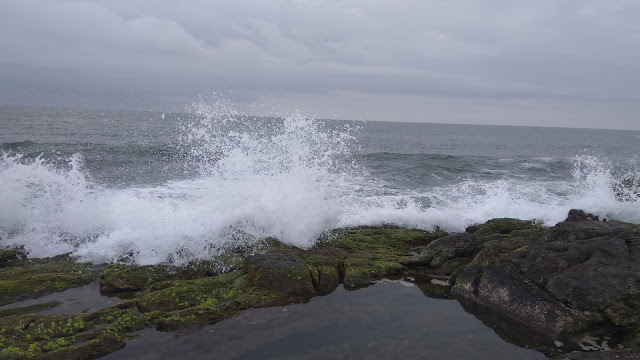
 Tarkarli is a small town place made famous by its white sand beaches and water sports.
We had started from Mumbai railway station to Sindhudurg station by an overnight train to spent our three day short vacation in Konkan in the west coast of India.
We reached by 10 am and luckily found a shared taxi to our small guest house which we had booked in advance.
(This place is not much commercialised hence hard to find luxury resorts here but staying in guest house with locals gives an another level of experience)
Our stay was right next to the Tarkarli beach from where the soothing sound of the sea waves lashing against the sandy beach is clearly audible.
After having our breakfast we went to beach for a long walk.
This place really offers an oceans bliss with soft white sand beaches, cool breeze and awesome sun shine.
After a delicious lunch with local delicacies we got a scooter on rent with around 300 INR/day without fuel for 3 days. And went to awesome Devbag beach and Wayari beach, both the beaches are untouched natural beauty.
Next day we had a early morning as we had to go for water sports to tsunami island.
We accompanied a group of around eight people who also stayed at the same guest house and enjoyed water sports like kayaking, high-speed motorboat and water scooter, banana ride, bumper ride, all of which was very thrilling. We also played with flying disc (frisbee) in the shallow island seas and had quite a fun. This place is quite famous for scuba as well.
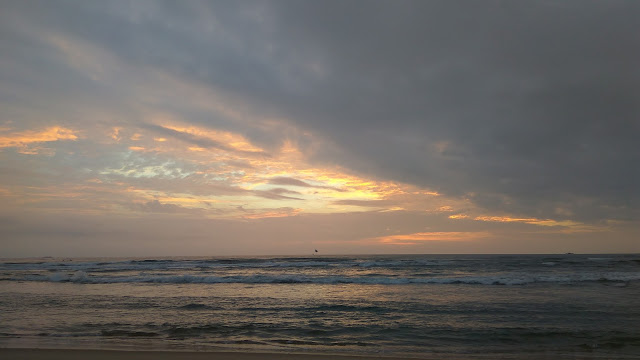
We returned to our stay before sunset and spend sunset time at calm and silent Tarkarli beach.

After dinner we all set and enjoyed camp fire on the beach with music and long chats.
Last day we had been to Sindhudurg fort and also visited awesome ocean rock garden.
 |
| Sindhudurg Fort |
 |
| Rock Garden |
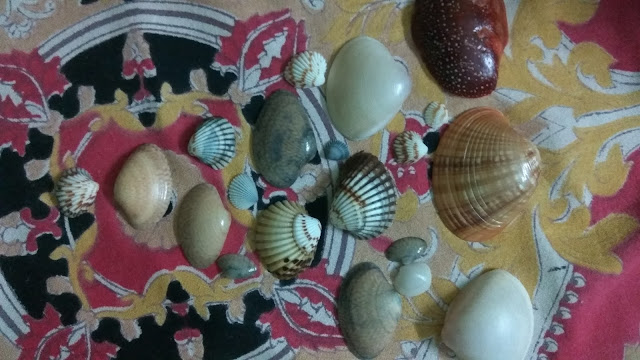
Like all good trips, we came back with some memorabilia as a token from the ocean


